Using GPUs on Isambard
This section presents information about GPU usage on Isambard. It is divided in subsections describing general information about the avaible hardware and common tasks associated with GPU-based workflows:
General GPU usage. This subsection describes the SLURM directives that need to be included in a job script to target partitions with GPUs.
Available CUDA Versions & Hardware Differences
Operating mode
Setting up a work environment. Many users working on Machine and Deep Learning tend to work with Python-based workflows. This subsection is focused on helping them transition from a local system (e.g. laptop) to an HPC system.
General GPU Usage
The PBS Pro scheduler controls the access to GPUs on a node such that access is only granted when the resource is requested specifically. With PBS Pro GPUs can be requested at job submission time via the following additional directive:
#PBS -l select=1:ncpus=64:ngpus=4
This directive requires PBS Pro to allocate four GPUs per allocated node, to not use nodes without GPUs and to grant access.
Jobs must also be submitted to the desired GPU-enabled nodes queue, for example:
#PBS -q ampereq # to request A100 GPUs
Or:
#PBS -q votalq # to request V100 GPUs
It is then possible to use CUDA enabled applications or the CUDA toolkit modules themselves, for example in the MAC cluster:
$ module load cuda11.2/toolkit/11.2.0
CUDA Versions & Hardware Differences
Isambard currently supports CUDA 11.2 (driver v460.32.03) on the pascalq and voltaq partitions; and CUDA 11.4 (driver v515.65.01) on the ampereq partition. AMD’s Linux kernel module, AMDgpu, is available on the instinctq partition (driver v5.11.32.21.40).
Isambard offer different GPU models with different numbers of devices per node. Some important differences between the available GPU devices available on Isambard are summarized in the table bellow:
queue |
nodes |
Accessible from login node |
GPU Model |
GPUs per node |
Memory per GPU (GB) |
Cores per GPU |
Tensor cores per GPU |
CPU Model |
CPUs per node |
|---|---|---|---|---|---|---|---|---|---|
pascalq |
4 |
login-01.isambard.gw4.ac.uk |
Nvidia Tesla P100 |
2 |
16 |
3584 |
N/A |
InteL Xeon E5-2695 |
36 |
voltaq |
4 |
login-01.isambard.gw4.ac.uk |
Nvidia Tesla V100 |
1 |
16 |
5120 |
640 (1st gen) |
Intel Xeon Gold 6230 |
40 |
ampereq |
2 |
p3login01.isambard.gw4.ac.uk |
Nvidia Ampere A100 |
4 |
40 |
6912 |
432 (3rd gen) |
AMD EPYC 7543P |
64 |
instinctq |
2 |
p3login01.isambard.gw4.ac.uk |
AMD Instinct MI100 |
4 |
32 |
7680 |
N/A |
AMD EPYC 7543P |
64 |
Tensor cores are a new type of programmable core exclusive to GPUs based on the Volta architecture that run alongside standard CUDA cores. Tensor cores can accelerate mixed-precision matrix multiply and accumulate calculations in a single operation. This capability is specially significant for AI/DL/ML applications that rely on large matrix operations.
Operating mode
NVIDIA GPU cards can be operated in a number of Compute Modes. In short the difference is whether multiple processes (and, theoretically, users) can access (share) a GPU or if a GPU is exclusively bound to a single process. It is typically application-specific whether one or the other mode is needed. On Isambard NVIDIA cards are set to “Default” (multiple contexts are allowed per device). Contact support if your application requires a different operating mode.
To query the Compute Mode in all cards:
for host in `cat $PBS_NODEFILE`; do
  ssh $host "nvidia-smi -q | grep 'Compute Mode'"
done
A sensible output should appear in the job output file.
Setting up a work environment
Running Python based workflows on Isambard
The traditional method to interact with remote HPC and cloud systems is through
the command line (via the ssh and scp commands), and although this might
require some adjustments for users more familar with GUIs like JupyterLab, it is
also the most efficient method and likely to be of benefit in the longer term.
This sections describes some of the most common steps when setting up a work
environment, Python in this example, as it is one of the most popular languages
used by researchers in the fields on Machine and Deep Learning.
Copying data
To work on Isambard with Python scripts written locally in our Desktop or Laptop
computer we need to transfer them over. Depending on our platform we can do this
using the scp command provided by Linux and MacOS to copy individual files and
scp -r to recursively copy your work directory over to your home directory
in Isambard:
$ scp -r python-code/ login-01.isambard.gw4.ac.uk:.
WARNING:
Unauthorised access may constitute a criminal offence.
All activity on the system is liable to monitoring.

Use of this system constitutes acceptance of our policies:
https://gw4-isambard.github.io/docs/policies/terms.html

User documentation: https://gw4-isambard.github.io/docs/

For support, please email isambard-support@gw4.ac.uk

python-novice-infla                           100% 7216    91.9KB/s   00:00
inflammation.png                              100%   19KB 209.3KB/s   00:00
argv_list.py                                  100%   42     0.5KB/s   00:00
readings_08.py                                100% 1097    12.4KB/s   00:00
readings_09.py                                100%  851     9.4KB/s   00:00
check.py                                      100% 1000    11.0KB/s   00:00
my_ls.py                                      100%  488     5.2KB/s   00:00
line_count.py                                 100%  920    10.0KB/s   00:00
readings_06.py                                100%  718     7.6KB/s   00:00
...
Installing Python libraries
The recommended approach is to create a Python virtual environment with a requirements.txt file which includes a list of all packages (and possibly versions) needed for your work. This file can be created and used in your local computer and then copied to Isambard to try to reproduce the same environment. An example file is:
numpy==1.19
pandas
numba
Isambard provides a default Python installation (3.6.8) on both MACS and Phase 3 clusters that can be used to install your virtual environment:
$ python3 --version
Python 3.6.8
Additionally, on MACS, Python 3.7.5 is avaiable via module files:
[login-01 ~]$ module load python37
[login-01 ~]$ python3 --version
Python 3.7.5
On Phase 3, Python 3.9.4.2 can be accessed through module files:
[p3-login ~]$ module load cray-python/3.9.4.2
[p3-login ~]$ python3 --version
Python 3.9.4
After selecting the appropiate Python version, you can proceed to install the virtual environment. In the example below we use the default Python3:
[login-01 ~]$ python3 -m venv --prompt myenv-macs ./myenv-macs
[login-01 ~]$ source ./myenv-macs/bin/activate
(myenv-macs) [login-01 ~]$
The above command will install a virtual environment named myenv-macs in a directory with a matching name in the current directory.
Consider upgrading pip before installing main packages:
(myenv-macs) [login-01 ~]$ python3 -m pip install --upgrade pip
Collecting pip
  Using cached https://files.pythonhosted.org/packages/a4/6d/6463d49a933f547439d6b5b98b46af8742cc03ae83543e4d7688c2420f8b/pip-21.3.1-py3-none-any.whl
Installing collected packages: pip
  Found existing installation: pip 9.0.3
    Uninstalling pip-9.0.3:
      Successfully uninstalled pip-9.0.3
Successfully installed pip-21.3.1
Then continue with the libraries installation:
(myenv-macs) [login-01 ~]$ pip install -r requirements.txt
Collecting numpy==1.19
  Downloading numpy-1.19.0-cp36-cp36m-manylinux2010_x86_64.whl (14.6 MB)
     |████████████████████████████████| 14.6 MB 24 kB/s
Collecting pandas
  Downloading pandas-1.1.5-cp36-cp36m-manylinux1_x86_64.whl (9.5 MB)
     |████████████████████████████████| 9.5 MB 571 bytes/s
Collecting python-dateutil>=2.7.3
  Downloading python_dateutil-2.8.2-py2.py3-none-any.whl (247 kB)
     |████████████████████████████████| 247 kB 63.4 MB/s
Collecting pytz>=2017.2
  Downloading pytz-2022.2.1-py2.py3-none-any.whl (500 kB)
     |████████████████████████████████| 500 kB 88.8 MB/s
Collecting six>=1.5
  Downloading six-1.16.0-py2.py3-none-any.whl (11 kB)
Installing collected packages: six, pytz, python-dateutil, numpy, pandas
Successfully installed numpy-1.19.0 pandas-1.1.5 python-dateutil-2.8.2 pytz-2022.2.1 six-1.16.0
If all goes well your Python libraries should be avaiable within your virtual environment. To deactivate the environment:
(myenv-macs) [login-01 ~]$ deactivate
[login-01 ~]$
Launching a GPU job
Consider the following test Python code that uses Numba to compute the value of a Gaussian probability density function at x with given mean and sigma:
#!/usr/bin/env python3
import math
import numpy as np
from numba import vectorize

SQRT_2PI = np.float32((2*math.pi)**0.5)

@vectorize(['float32(float32, float32, float32)'], target='cpu')
def gaussian_pdf(x, mean, sigma):
    return math.exp(-0.5 * ((x - mean) / sigma)**2) / (sigma * SQRT_2PI)

# Evaluate the Gaussian a million times
x = np.random.uniform(-3, 3, size=1000000).astype(np.float32)
mean = np.float32(0.0)
sigma = np.float32(1.0)

gaussian_pdf(x, mean, sigma)

print("job done")
Now that we have our Python script, we need to create an additional file (job script) to place it in the queue (submit the job). Make sure to remove any commands from the Python script that might need additional confirmation or user interaction as you won’t be able to provide it with this method of execution. The following is the content an example job script for MACS:
#!/bin/bash
#PBS -N pascalq
#PBS -q pascalq
#PBS -l select=1:ncpus=18:ngpus=1
#PBS -l walltime=00:15:00

# select -- allocate # separate nodes
# ncpus  -- on each node allocate # cpus (cores)
# ngpus  -- on each node allocate # gpus

set -eu

module purge
module load cuda11.2/toolkit/11.2.0
module list

# confirm which python version are we using
which python3
python3 --version

# Load local python environment
source ~/myenv-macs/bin/activate

cp $PBS_O_WORKDIR/gaussian.py .

time python3 gaussian.py
To submit (put it queue) the above script, on Isambard:
[login-01 ~]$ qsub run-macs-pascal.sh
59821.gw4head
You can query the current state of this job with:
[login-01 ~]$ qstat -u $USER

gw4head:
                                                            Req'd  Req'd   Elap
Job ID          Username Queue    Jobname    SessID NDS TSK Memory Time  S Time
--------------- -------- -------- ---------- ------ --- --- ------ ----- - -----
59823.gw4head   ca-munoz pascalq  pascalq    157907   1  18    --  00:15 R 00:00
This particular job might not spend a long time in queue and the above output might not show it, but on completion there should be a pascalq.oXXXXX and pascalq.eXXXXX (with the XXXXX matching your job id number) files created in the current directory with the output and error messages (if any) produced by our script.
Identifying memory access errors with NVIDIA Compute Sanitizer
Compute Sanitizer is a functional correctness checking suite included in the CUDA
toolkit. This suite contains multiple tools that can perform different type of checks.
The memcheck tool is capable of precisely detecting and attributing out of bounds
and misaligned memory access errors in CUDA applications. The tool can also report
hardware exceptions encountered by the GPU. The racecheck tool can report shared
memory data access hazards that can cause data races. The initcheck tool can report
cases where the GPU performs uninitialized accesses to global memory. The synccheck
tool can report cases where the application is attempting invalid usages of
synchronization primitives. This section focuses on the use of memcheck and the
main steps to access the tool on Hawk, and demonstrates how apply it on a simple
example. You can find more details on the user manual for Compute Sanitizer.
Accessing memcheck
To access NVIDIA Compute Sanitizer on Isambard, load the latest CUDA module:
$ module load cuda11.2/toolkit/11.2.0
$ compute-sanitizer --version
NVIDIA (R) Compute Sanitizer
Copyright (c) 2020-2020 NVIDIA Corporation
Version 2020.3.0
On Phase 3 NVIDIA Compute Sanitizer on Isambard is only accessible from the compute nodes, for example:
[p3-login ~]$ qsub -I -q ampereq -l select=1:ngpus=4 -l walltime=01:00:00
[p3-gpu01-compute ~]$ module load nvidia/21.11
[p3-gpu01-compute ~]$ compute-sanitizer --version
NVIDIA (R) Compute Sanitizer
Copyright (c) 2020-2021 NVIDIA Corporation
Version 2021.3.1
Consider the following code (from CUDA-MEMCHECK user manual):
#include <stdio.h>

__device__ int x;

__global__ void unaligned_kernel(void) {
    *(int*) ((char*)&x + 1) = 42;
}

__device__ void out_of_bounds_function(void) {
    *(int*) 0x87654320 = 42;
}

__global__ void out_of_bounds_kernel(void) {
    out_of_bounds_function();
}

void run_unaligned(void) {
    printf("Running unaligned_kernel\n");
    unaligned_kernel<<<1,1>>>();
    printf("Ran unaligned_kernel: %s\n",
    cudaGetErrorString(cudaGetLastError()));
    printf("Sync: %s\n", cudaGetErrorString(cudaDeviceSynchronize()));
}

void run_out_of_bounds(void) {
    printf("Running out_of_bounds_kernel\n");
    out_of_bounds_kernel<<<1,1>>>();
    printf("Ran out_of_bounds_kernel: %s\n",
    cudaGetErrorString(cudaGetLastError()));
    printf("Sync: %s\n", cudaGetErrorString(cudaDeviceSynchronize()));
}

int main() {
    int *devMem;

    printf("Mallocing memory\n");
    cudaMalloc((void**)&devMem, 1024);

    run_unaligned();
    run_out_of_bounds();

    cudaDeviceReset();
    cudaFree(devMem);

    return 0;
}
Compilation
Use the following command to compile the code above with details about line numbers where errors occur:
$ nvcc -Xcompiler -rdynamic -lineinfo -o memcheck_demo memcheck_demo.cu
In the above command the -lineinfo option is used to generate line number information
for applications without affecting the optimization level of the output. The -rdynamic
option is given to the host compiler to retain function symbols names which is useful
in stack backtrace. Note that when using nvcc, flags to the host compiler can be
specified using the -Xcompiler option.
Running NVIDIA Compute Sanitizer
Running CUDA programs on Isambard requires access to a GPU node. There is two options available, an interactive session and a job script. If you attempt to run CUDA programs on the login nodes or compute nodes without GPU access you may receive a error message similar to the one below:
$ compute-sanitizer --tool memcheck memcheck_demo
========= COMPUTE-SANITIZER
Mallocing memory
Running unaligned_kernel
Ran unaligned_kernel: no CUDA-capable device is detected
Sync: no CUDA-capable device is detected
Running out_of_bounds_kernel
Ran out_of_bounds_kernel: no CUDA-capable device is detected
Sync: no CUDA-capable device is detected
========= Error: Target application terminated before first instrumented API call
On Isambard, you can request an interactive session with the following command (example for pascalq on MACS, please adapt for voltaq of ampereq if needed):
$ qsub -I -q pascalq -l select=1:ngpus=1 -l walltime=01:00:00
qsub: waiting for job 59831.gw4head to start
qsub: job 59831.gw4head ready
remember to change the above options to fit your code requirements.
Load the latest CUDA module, change to your work directory and run compute sanitizer in debug mode:
$ module load cuda11.2/toolkit/11.2.0
$ cd $PBS_O_WORKDIR
$ compute-sanitizer --log-file=memcheck_demo_debug.log --destroy-on-device-error kernel --leak-check full --tool memcheck memcheck_demo
Mallocing memory
Running unaligned_kernel
Ran unaligned_kernel: no error
Sync: no error
Running out_of_bounds_kernel
Ran out_of_bounds_kernel: no error
Sync: no error
In the above command --log-file allows you to save the filename of the file
where the output of compute-sanitizer should be saved;
--destroy-on-device-error kernel
controls how the application proceeds on hitting a memory access error, in this
case the kernel option specifies that the kernel must be terminated without
running any subsequent instructions and the application continues launching other
kernels in the CUDA context; --leak-check prints information about all
allocations that have not been freed via cudaFree at the point when the context was
destroyed.
Executing the command above will produce a file named
memcheck_demo_debug.log
that we can analyze later on.
A potentially more convenient way to run Compute Sanitizer is through the job scheduler (especially for jobs with long runtimes). The method is very similar to running the application through the command line but a job script with appropiate directives to interact with the job scheduler is also needed. On Isambard we use PBS Pro and the following job script could give you a good starting point:
#!/bin/bash
#PBS -N pascalq
#PBS -q pascalq
#PBS -l select=1:ncpus=18:ngpus=1
#PBS -l walltime=00:15:00

set -eu

module purge
module load cuda11.2/toolkit/11.2.0
module list

code=memcheck_demo
logfile=memcheck_demo.${PBS_JOBID}.log

echo $PWD
cp $PBS_O_WORKDIR/$code .

compute-sanitizer --log-file=$logfile --destroy-on-device-error kernel --leak-check full --tool memcheck $code

mv $logfile $PBS_O_WORKDIR
Compute Sanitizer memcheck output
Exporing the output produced by memcheck we can find useful information like:
========= Invalid __global__ write of size 4 bytes
=========     at 0x30 in /lustre/home/ca-munozcjj/gpudocs/files/memcheck_demo.cu:6:unaligned_kernel(void)
=========     by thread (0,0,0) in block (0,0,0)
=========     Address 0x15551a800001 is misaligned
=========     Saved host backtrace up to driver entry point at kernel launch time
The above information can hopefully point you towards the region in the code likely to benefit from further reviewing (line 6 in this example).
Profiling
NVIDIA Nsight Systems
Isambard offers access to NVIDIA Nsight Systems and NVIDIA compilers as part of its standard module files.
Loading the profiler
To access NVIDIA Nsight Systems on Isambard run the following command:
On MACS users can access CUDA either on the login and compute nodes:
$ module load cuda11.1/nsight/11.1.1
$ nsys --version
NVIDIA Nsight Systems version 2020.3.4.32-52657a0
On Phase 3, nsys is only available through the compute nodes:
[username@p3-gpu01-compute ~]$ module load nvidia/21.11
[username@p3-gpu01-compute ~]$ nsys --version
NVIDIA Nsight Systems version 2021.4.1.73-08591f7
Example CUDA C++ program
The usual workflow involves wriing code in CUDA C++, compiling, profiling, analysing, optimising and repeating. Consider the following code:
/*
 *   Vector addition example using CUDA.
 *   This is a non-optimised example that is likely to benefit
 *   from
 *   - adaptig the main kernel launch configuration, so that
 *     it creates a grid containing a number of blocks that is
 *     a multiple of the number of SMs on the device.
 */
#include <stdio.h>

/*
 * Host function to initialize input vector elements. This
 * function simply initializes each element in the vector to
 * a constant number 'num'.
 */

void initWith(float num, float *a, int N)
{
  for(int i = 0; i < N; ++i)
  {
    a[i] = num;
  }
}

/*
 * Device kernel stores into `result` the sum of
 * corresponding elements in input vectors `a` and
 * `b`. Note that the function assumes `a` and `b`
 * are of the same size N.
 */

__global__
void addVectorsInto(float *result, float *a, float *b, int N)
{
  int index = threadIdx.x + blockIdx.x * blockDim.x;
  int stride = blockDim.x * gridDim.x;

  for(int i = index; i < N; i += stride)
  {
    result[i] = a[i] + b[i];
  }
}

/*
 * Host function to confirm values in `vector`. This function
 * assumes all values are the same `target` value.
 */

void checkElementsAre(float target, float *vector, int N)
{
  for(int i = 0; i < N; i++)
  {
    if(vector[i] != target)
    {
      printf("FAIL: vector[%d] - %0.0f does not equal %0.0f\n", i, vector[i], target);
      exit(1);
    }
  }
  printf("All values were calculated correctly. Well done.\n");
}

int main()
{
  const int N = 50000000;
  size_t size = N * sizeof(float);

  float *a;
  float *b;
  float *c;

  cudaMallocManaged(&a, size);
  cudaMallocManaged(&b, size);
  cudaMallocManaged(&c, size);

  initWith(3, a, N);
  initWith(7, b, N);
  initWith(0, c, N);

  size_t threadsPerBlock;
  size_t numberOfBlocks;

  threadsPerBlock = 32;
  numberOfBlocks = 32;

  cudaError_t addVectorsErr;
  cudaError_t asyncErr;

  addVectorsInto<<<numberOfBlocks, threadsPerBlock>>>(c, a, b, N);

  addVectorsErr = cudaGetLastError();
  if(addVectorsErr != cudaSuccess) printf("Error: %s\n", cudaGetErrorString(addVectorsErr));

  asyncErr = cudaDeviceSynchronize();
  if(asyncErr != cudaSuccess) printf("Error: %s\n", cudaGetErrorString(asyncErr));

  checkElementsAre(10, c, N);

  cudaFree(a);
  cudaFree(b);
  cudaFree(c);
}
Compilation
The above code can be compiled and tested using an interactive session:
$ qsub -I -q voltaq -l select=1:ngpus=1 -l walltime=01:00:00
Once our session is granted and we are placed on the GPU node where we can load and check our compilers:
$ module load cuda11.2/toolkit/11.2.0
$ nvcc --version
nvcc: NVIDIA (R) Cuda compiler driver
Copyright (c) 2005-2020 NVIDIA Corporation
Built on Mon_Nov_30_19:08:53_PST_2020
Cuda compilation tools, release 11.2, V11.2.67
Build cuda_11.2.r11.2/compiler.29373293_0
To compile our code:
$ nvcc -o vector-add -run vector-add.cu
All values were calculated correctly. Well done.
At this point your code is ready to be executed on the GPUs (and it already was, since we used the -run option in nvcc). To profile the code we can use the nsys command.
Notice that nsys is part of CUDA 11.1 instead of CUDA 11.2:
$ module purge
$ module load cuda11.1/nsight/11.1.1
$ nsys profile --stats=true ./vector-add
Collecting data...
All values were calculated correctly. Well done.
Processing events...
Capturing symbol files...
Saving temporary "/var/tmp/pbs.59996.gw4head/nsys-report-a2a5-559b-a761-9ba6.qdstrm" file to disk...
Creating final output files...

Processing [==============================================================100%]
Saved report file to "/var/tmp/pbs.59996.gw4head/nsys-report-a2a5-559b-a761-9ba6.qdrep"
Exporting 21697 events: [=================================================100%]

Exported successfully to
/var/tmp/pbs.59996.gw4head/nsys-report-a2a5-559b-a761-9ba6.sqlite

Generating CUDA API Statistics...
CUDA API Statistics (nanoseconds)

Time(%)      Total Time       Calls         Average         Minimum         Maximum  Name
-------  --------------  ----------  --------------  --------------  --------------  --------------------------------------------------------------------------------
   64.1       287742959           3      95914319.7           31610       287670830  cudaMallocManaged
   28.0       125588589           1     125588589.0       125588589       125588589  cudaDeviceSynchronize
    8.0        35735765           3      11911921.7        10924248        12877577  cudaFree
    0.0           49154           1         49154.0           49154           49154  cudaLaunchKernel


Generating CUDA Kernel Statistics...
CUDA Kernel Statistics (nanoseconds)

Time(%)      Total Time   Instances         Average         Minimum         Maximum  Name
-------  --------------  ----------  --------------  --------------  --------------  --------------------------------------------------------------------------------------------------------------------
  100.0       125590094           1     125590094.0       125590094       125590094  addVectorsInto(float*, float*, float*, int)


Generating CUDA Memory Operation Statistics...
CUDA Memory Operation Statistics (nanoseconds)

Time(%)      Total Time  Operations         Average         Minimum         Maximum  Name
-------  --------------  ----------  --------------  --------------  --------------  --------------------------------------------------------------------------------
   77.8        27403374        3450          7943.0            1098           44971  [CUDA Unified Memory memcpy HtoD]
   22.2         7819653        1150          6799.7             732           38479  [CUDA Unified Memory memcpy DtoH]


CUDA Memory Operation Statistics (KiB)

              Total      Operations              Average            Minimum              Maximum  Name
-------------------  --------------  -------------------  -----------------  -------------------  --------------------------------------------------------------------------------
         585948.000            3450              169.840              4.000             1020.000  [CUDA Unified Memory memcpy HtoD]
         195316.000            1150              169.840              4.000             1020.000  [CUDA Unified Memory memcpy DtoH]


Generating Operating System Runtime API Statistics...
Operating System Runtime API Statistics (nanoseconds)

Time(%)      Total Time       Calls         Average         Minimum         Maximum  Name
-------  --------------  ----------  --------------  --------------  --------------  --------------------------------------------------------------------------------
   84.1      1655258416          90      18391760.2           36428       100129785  poll
    8.7       171812553          79       2174842.4           18716        21119503  sem_timedwait
    4.6        90750151         802        113154.8            1020        32925829  ioctl
    2.0        38514232         102        377590.5            1327        12830833  mmap
    0.2         3296748          29        113681.0            1075         1103165  fopen
    0.2         3235094           1       3235094.0         3235094         3235094  fflush
    0.2         3032036           6        505339.3            1062         2670607  fclose
    0.0          591167          98          6032.3            1561           15621  open64
    0.0          533813           1        533813.0          533813          533813  fwrite
    0.0          500728           4        125182.0            1902          482612  fread
    0.0          409392           5         81878.4            1267          125335  fcntl
    0.0          359123           4         89780.7           83207           97768  pthread_create
    0.0          103816           3         34605.3           30800           42164  fgets
    0.0           50423          15          3361.5            1556            4795  write
    0.0           39391          11          3581.0            1379            5948  munmap
    0.0           24094           5          4818.8            2158            8960  open
    0.0            6367           2          3183.5            3012            3355  socket
    0.0            5262           1          5262.0            5262            5262  pipe2
    0.0            4426           1          4426.0            4426            4426  connect
    0.0            2569           2          1284.5            1107            1462  read
    0.0            2079           2          1039.5            1033            1046  pthread_mutex_trylock
    0.0            1082           1          1082.0            1082            1082  bind


Generating NVTX Push-Pop Range Statistics...
NVTX Push-Pop Range Statistics (nanoseconds)


Report file moved to "/lustre/home/ca-munozcjj/pbs.59996.gw4head.x8z/report1.qdrep"
Report file moved to "/lustre/home/ca-munozcjj/pbs.59996.gw4head.x8z/report1.sqlite"
The above code can be compiled and tested using an interactive session:
$ qsub -I -q ampereq -l select=1:ngpus=1 -l walltime=01:00:00
Once our session is granted and we are placed on the GPU node where we can load and check our compilers:
$ module load nvidia
$ nvcc --version
nvcc: NVIDIA (R) Cuda compiler driver
Copyright (c) 2005-2021 NVIDIA Corporation
Built on Thu_Nov_18_09:45:30_PST_2021
Cuda compilation tools, release 11.5, V11.5.119
Build cuda_11.5.r11.5/compiler.30672275_0
To compile our code:
$ nvcc -o vector-add -run vector-add.cu
All values were calculated correctly. Well done.
At this point your code is ready to be executed on the GPUs (and it already was, since we used the -run option in nvcc). To profile the code we can use the nsys command:
$ nsys profile -b dwarf --sample=cpu --trace=nvtx,osrt,opengl --stats=true ./vector-add
Collecting data...
All values were calculated correctly. Well done.
Processing events...
Saving temporary "/var/tmp/pbs.17063.p3-pbs/nsys-report-3b1b-78fd-56ed-e39c.qdstrm" file to disk...
Creating final output files...
Processing [===============================================================100%]
Saved report file to "/var/tmp/pbs.17063.p3-pbs/nsys-report-3b1b-78fd-56ed-e39c.nsys-rep"
Exporting 3807 events: [===================================================100%]

Exported successfully to
/var/tmp/pbs.17063.p3-pbs/nsys-report-3b1b-78fd-56ed-e39c.sqlite


Operating System Runtime API Statistics:

 Time(%)  Total Time (ns)  Num Calls    Avg (ns)      Med (ns)    Min (ns)   Max (ns)    StdDev (ns)        Name
 -------  ---------------  ---------  ------------  ------------  --------  -----------  ------------  --------------
    68.8      600,540,655         20  30,027,032.8  14,105,501.5     3,707  100,112,106  38,730,719.1  poll
    27.0      236,117,370        829     284,821.9      15,008.0     1,002   14,538,905     775,386.5  ioctl
     3.8       33,416,799         21   1,591,276.1       3,607.0     1,403   11,382,042   3,984,272.7  mmap
     0.1          827,199         42      19,695.2       4,062.5     3,506      501,792      76,552.0  mmap64
     0.1          805,921         36      22,386.7       2,755.5     1,172      390,502      72,835.0  fopen
     0.1          587,804         12      48,983.7      27,206.0    18,776      289,874      75,952.3  sem_timedwait
     0.0          301,588         66       4,569.5       4,003.0     1,764       17,593       2,163.0  open64
     0.0          289,654          4      72,413.5      61,966.5     1,413      164,308      83,730.8  fcntl
     0.0          233,728          8      29,216.0       1,418.0     1,132      126,287      52,123.7  fclose
     0.0          140,393          2      70,196.5      70,196.5    69,500       70,893         985.0  pthread_create
     0.0           40,718          3      13,572.7      15,059.0     4,098       21,561       8,825.9  fread
     0.0           40,546          1      40,546.0      40,546.0    40,546       40,546           0.0  fgets
     0.0           36,349         11       3,304.5       3,236.0     1,092        7,334       1,882.3  munmap
     0.0           34,277         13       2,636.7       2,805.0     1,784        3,487         567.2  write
     0.0           15,130          4       3,782.5       3,717.5     2,184        5,511       1,472.8  open
     0.0            5,931          1       5,931.0       5,931.0     5,931        5,931           0.0  pipe2
     0.0            4,559          3       1,519.7       1,463.0     1,313        1,783         240.1  read
     0.0            4,128          2       2,064.0       2,064.0     1,763        2,365         425.7  socket
     0.0            3,487          1       3,487.0       3,487.0     3,487        3,487           0.0  connect
     0.0            1,342          1       1,342.0       1,342.0     1,342        1,342           0.0  bind

Report file moved to "/lustre/home/ca-munozcjj/gpudocs/profilers/nsys/phase3/report2.nsys-rep"
Report file moved to "/lustre/home/ca-munozcjj/gpudocs/profilers/nsys/phase3/report2.sqlite"
Attention
In the above example we explicitly didn’t include cuda tracing
(--trace=nvtx,osrt,opengl) as this currently produces a core dumped
error message. At the moment this limits the information provided by the
profiler. The tech team is currently investigating.
The nsys command has several possible options available (see
nsys profile --help), among them --stats=true triggers the generation of
a statistics summary and the creation of two files:
report1.qdrep
report1.sqlite
The statistics summary output includes different CUDA operations performed by our program including the time consumed by our main kernel addVectorsInto. Additionally, it also provides us statistical information about how much time is spent transferring data back and forth between the GPU and the CPU. At this point we could make changes to our code (e.g. change the launch configuration, memory prefetching) and explore its impact on these numbers to try to find optimal settings.
Visualize profiler results
The files generated by nsys profile can in principle be used to explore our code
timeline using NVIDIA visual profiler Nsight Systems. However, Isambard doesn’t currently
support X11 connections but the files may still be useful if the user has a local
installation of the visual profiler.
Arm Forge MAP
MAP - part of the Arm Forge toolsuite for high performance software - is an intuitive graphical profiler that can show how much time was spent on each line of code.
Loading the profiler
You can access Arm Forge toolset (MAP, DDT and Performance Reports) on both MACS and Phase3 with the following command:
$ module use /software/x86/modulefiles
$ module load tools/arm-forge/20.1
You can use MAP’s GPU profiling capabilities when working with CUDA programs (CUDA kernels generated by OpenACC, CUDA Fortran, or off loaded OpenMP regions are not yet supported by Arm MAP).
Compiler flags and compilation
Consider the previous example using CUDA C++.
In order to prepare our program to be profiled with MAP we need to compile it with
debugging symbols (-g) and in some cases it might need to be relinked. Typically
you should keep optimization flags enabled when profiling (rather than profiling a
debug build). This will give more representative results. The recommended set of
compilation flags for CUDA kernels are:
-g -lineinfo -O3
Therefore we can compile our example program with:
$ qsub -I -q pascalq -l select=1:ngpus=1 -l walltime=01:00:00
Once our session is granted and we are placed on the GPU node where we can load and compile the code:
$ module load cuda11.2/toolkit/11.2.0
$ nvcc -c -o vector-add.o -g -lineinfo -O3 vector-add.cu
$ nvcc vector-add.o -o vector-add
Therefore we can compile our example program with:
$ qsub -I -q ampereq -l select=1:ngpus=1 -l walltime=01:00:00
Once our session is granted and we are placed on the GPU node where we can load and compile the code:
$ module load nvidia/21.11
$ nvcc -c -o vector-add.o -g -lineinfo -O3 vector-add.cu
$ nvcc vector-add.o -o vector-add
This generates a vector-add executable in our current directory. There are two alternative methods to run MAP on our executable and generate a report (a map file) with the profiling information for later analysis. The first method uses an interactive session on a GPU node while the second runs MAP through a job script. Both methods allow you to interact with the profiler through the command line but the former also allows you to run the profiler’s GUI and analize the results as soon as the program completes execution so it is useful for relatively short runtime programs.
Running the profiler
The following examples show how to run MAP on MACS, please adapt the instructions (i.e. select corresponding partitions and module files) to run on Phase3.
With an interactive session you can run the profiler through the command line or using MAP’s GUI. In both cases you first need to request the interactive session.
Request an interactive session (no need to do it again if already in an interactive session):
[login-01 ~]$ qsub -I -q pascalq -l select=1:ngpus=1 -l walltime=01:00:00
To run the profiler using the command line follow this steps:
[pascal-003 ~]$ module use /software/x86/modulefiles
[pascal-003 ~]$ module load tools/arm-forge/20.1
[pascal-003 ~]$ ALLINEA_SAMPLER_INTERVAL=1 map --profile vector-add
Arm Forge 21.0 - Arm MAP

Profiling          : /lustre/home/ca-munozcjj/gpudocs/profilers/arm/macs/vector-add
Allinea sampler    : not preloading
MPI implementation : Auto-Detect (None)

All values were calculated correctly. Well done.

MAP analysing program...
MAP gathering samples...
MAP generated /lustre/home/ca-munozcjj/gpudocs/profilers/arm/macs/vector-add_1p_1n_40t_2022-10-14_19-42.map
The environment variable ALLINEA_SAMPLER_INTERVAL controls how often samples are taken in your code (in ms). By default MAP will sample the code every 20 ms but if the code runs for a small amount of time (like in our example) it might be good to increase the sampling rate (the maximum sampling rate is 1000 Hz or 1 ms).
If all goes well MAP will generate a map file in the current directory which can be analised later on with MAP GUI on the login nodes.
To run MAP’s GUI we need to access the MACS cluster with X11 enabled:
$ ssh -Y login.isambard
We need to request an interactive session with X11 enabled:
[login-01 ~]$ qsub -I -X -q pascalq -l select=1:ngpus=1 -l walltime=01:00:00
qsub: waiting for job 62482.gw4head to start
qsub: job 62482.gw4head ready

cd /home/ca-munozcjj/pbs.62482.gw4head.x8z
xauth:  file /home/ca-munozcjj/pbs.62482.gw4head.x8z/.Xauthority does not exist
When the request is granted you should be placed in the allocated node. You can now load Arm Forge and execute MAP:
[pascal-003 ~]$ module use /software/x86/modulefiles
[pascal-003 ~]$ module load tools/arm-forge/20.1
[pascal-003 ~]$ export ALLINEA_SAMPLER_INTERVAL=1
[pascal-003 ~]$ map
The environment variable ALLINEA_SAMPLER_INTERVAL controls how often samples are taken in your code (in ms). By default MAP will sample the code every 20 ms but if the code runs for a small amount of time (like in our example) it might be good to increase the sampling rate (the maximum sampling rate is 1000 Hz or 1 ms).
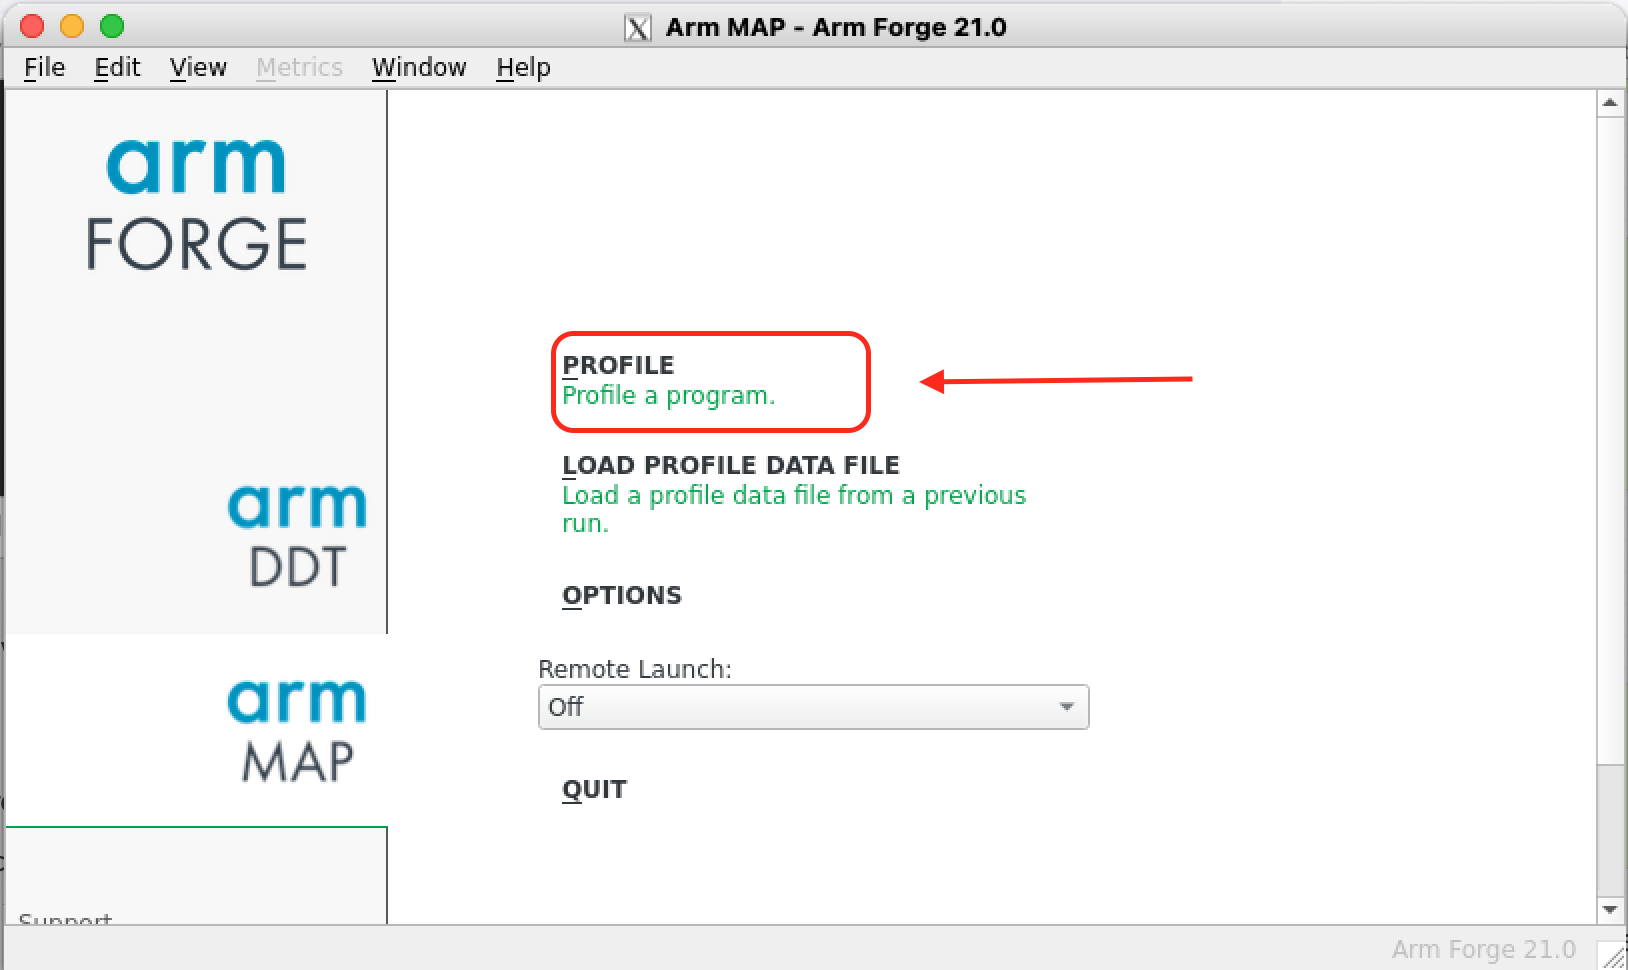
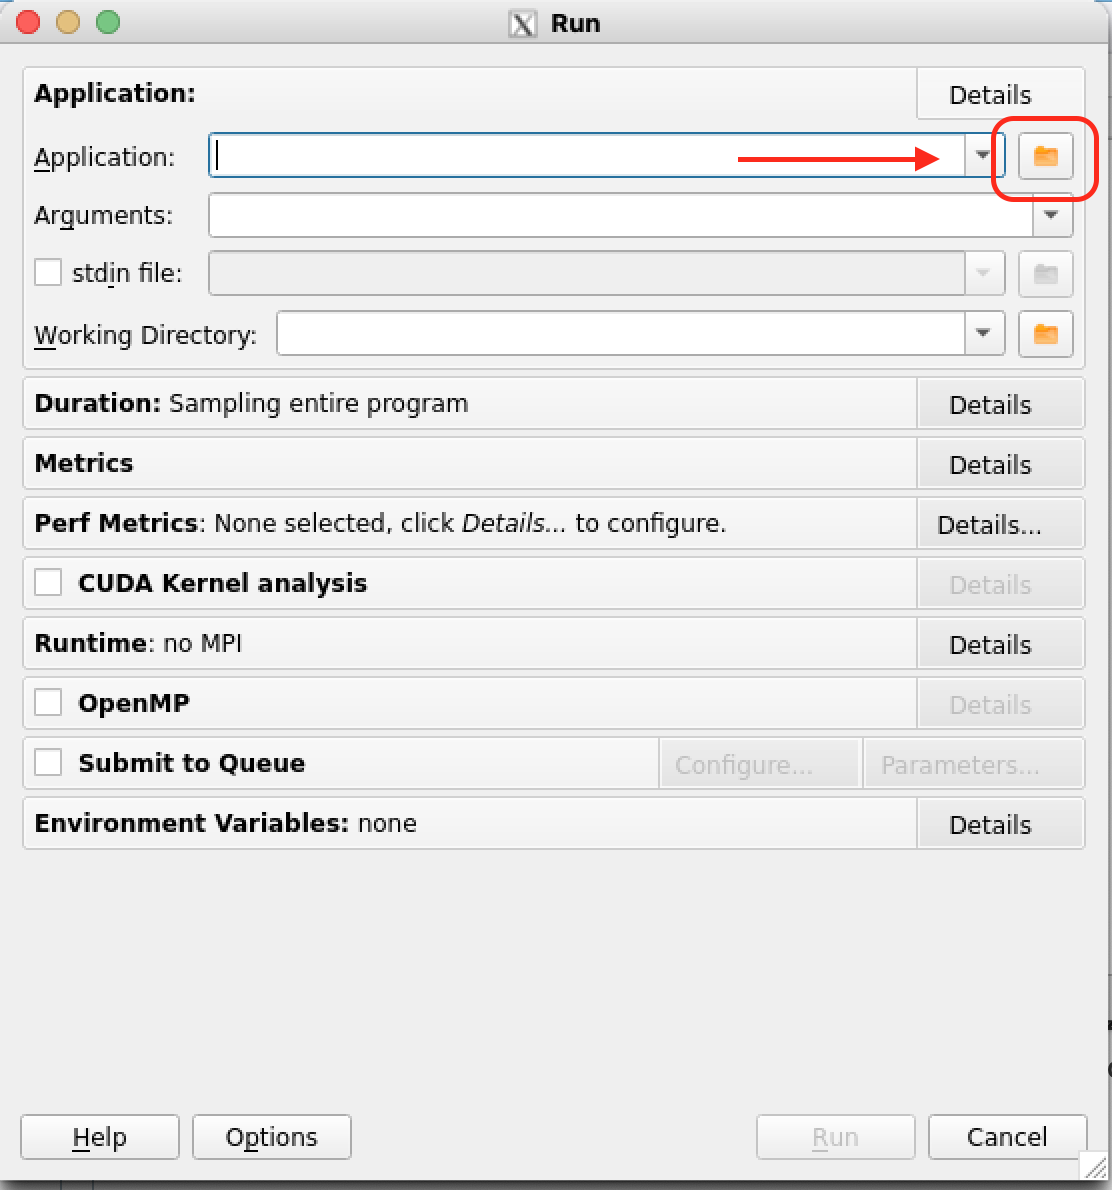
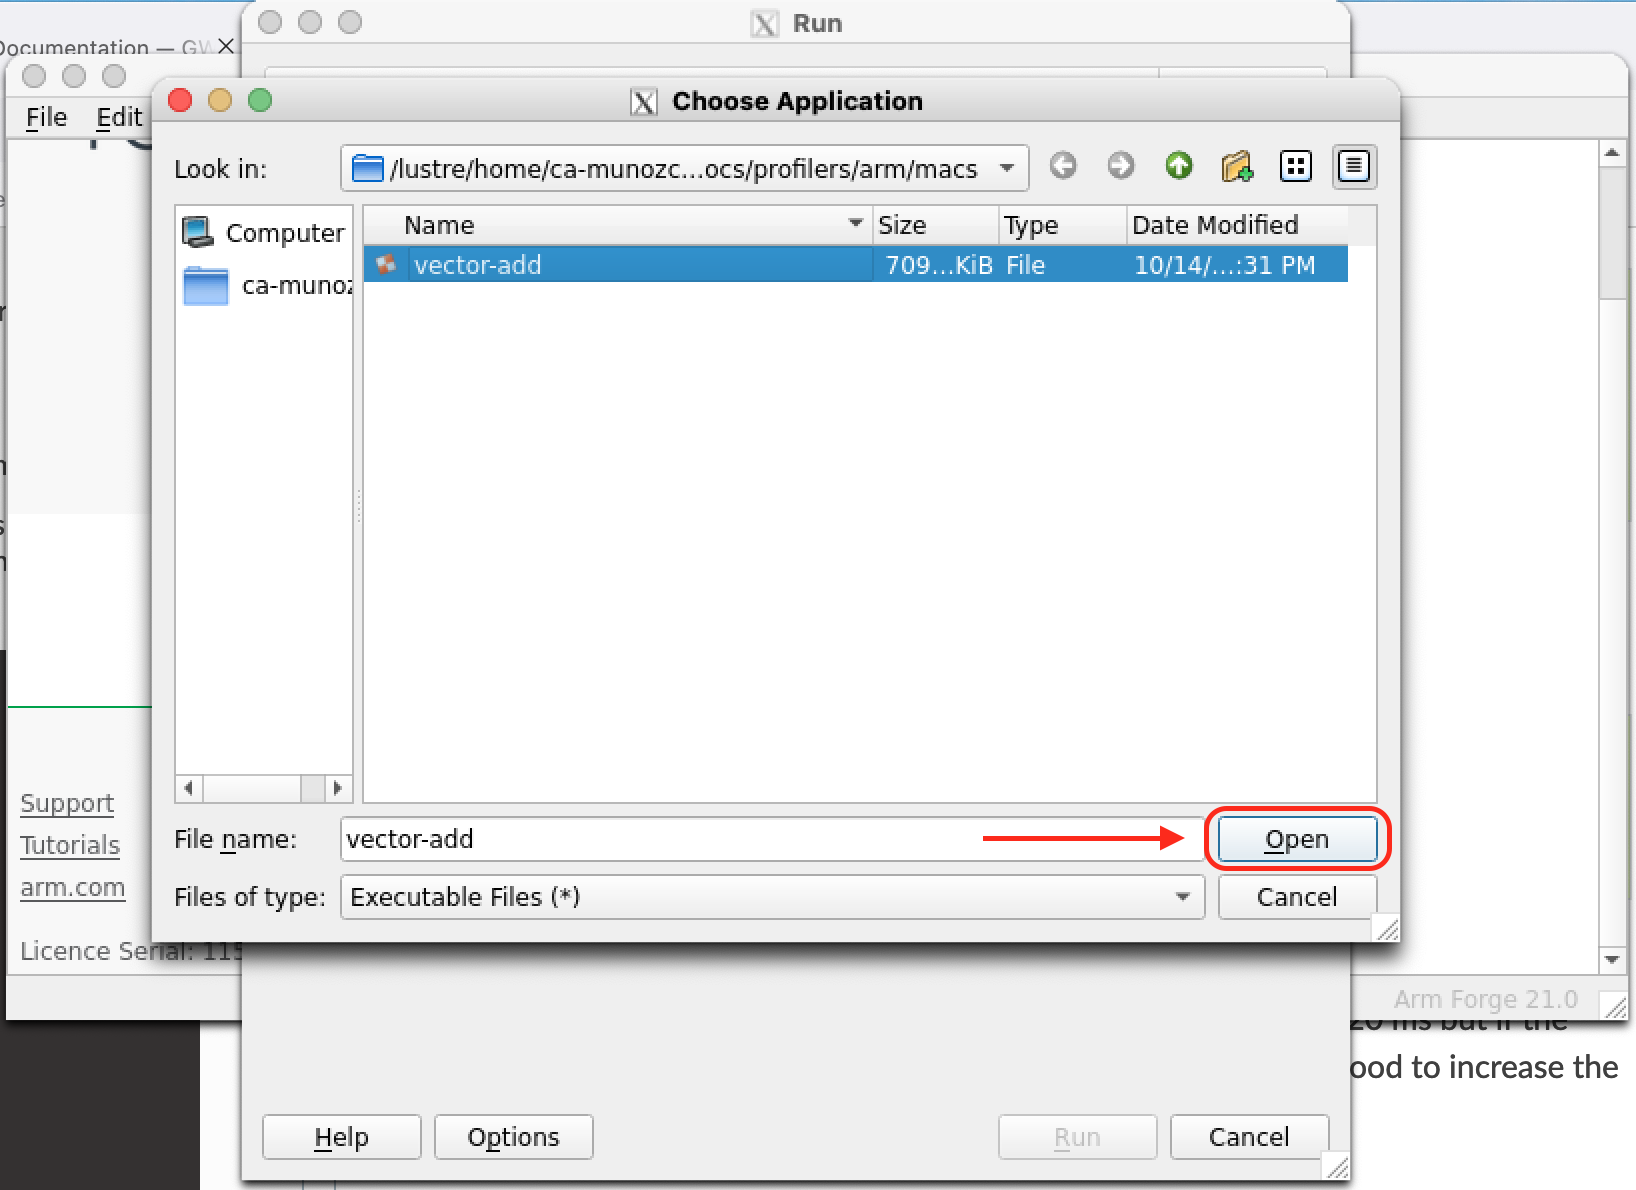
If everything goes well you should see a new window similar to the left figure below. Select Profile a program, this will open a new window where you can search for the program to be profiled in the field Application (right figure below).
|
|
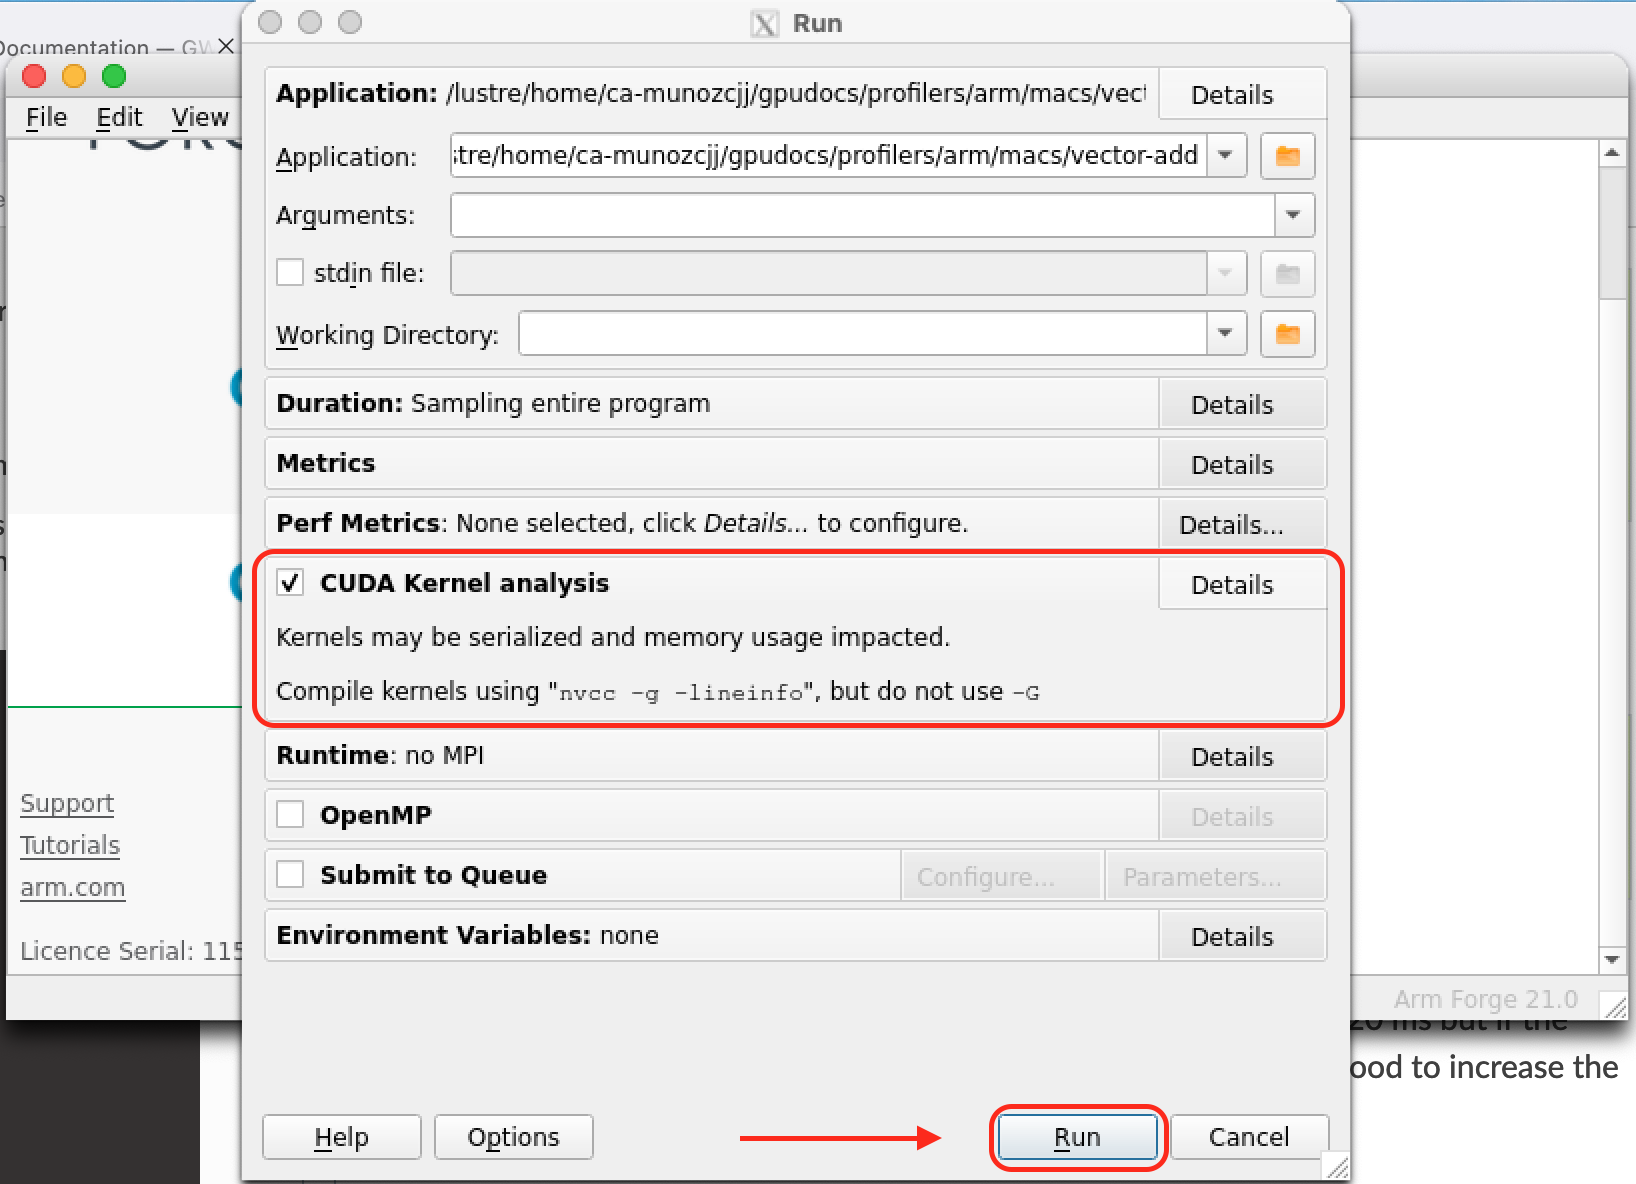
Select and open the application to profile (left figure below). Back on the Run menu there are several options that allow you to control for example the different Metrics to be monitored. Select the CUDA Kernel Analysis field to extract additional information from your CUDA kernels.
|
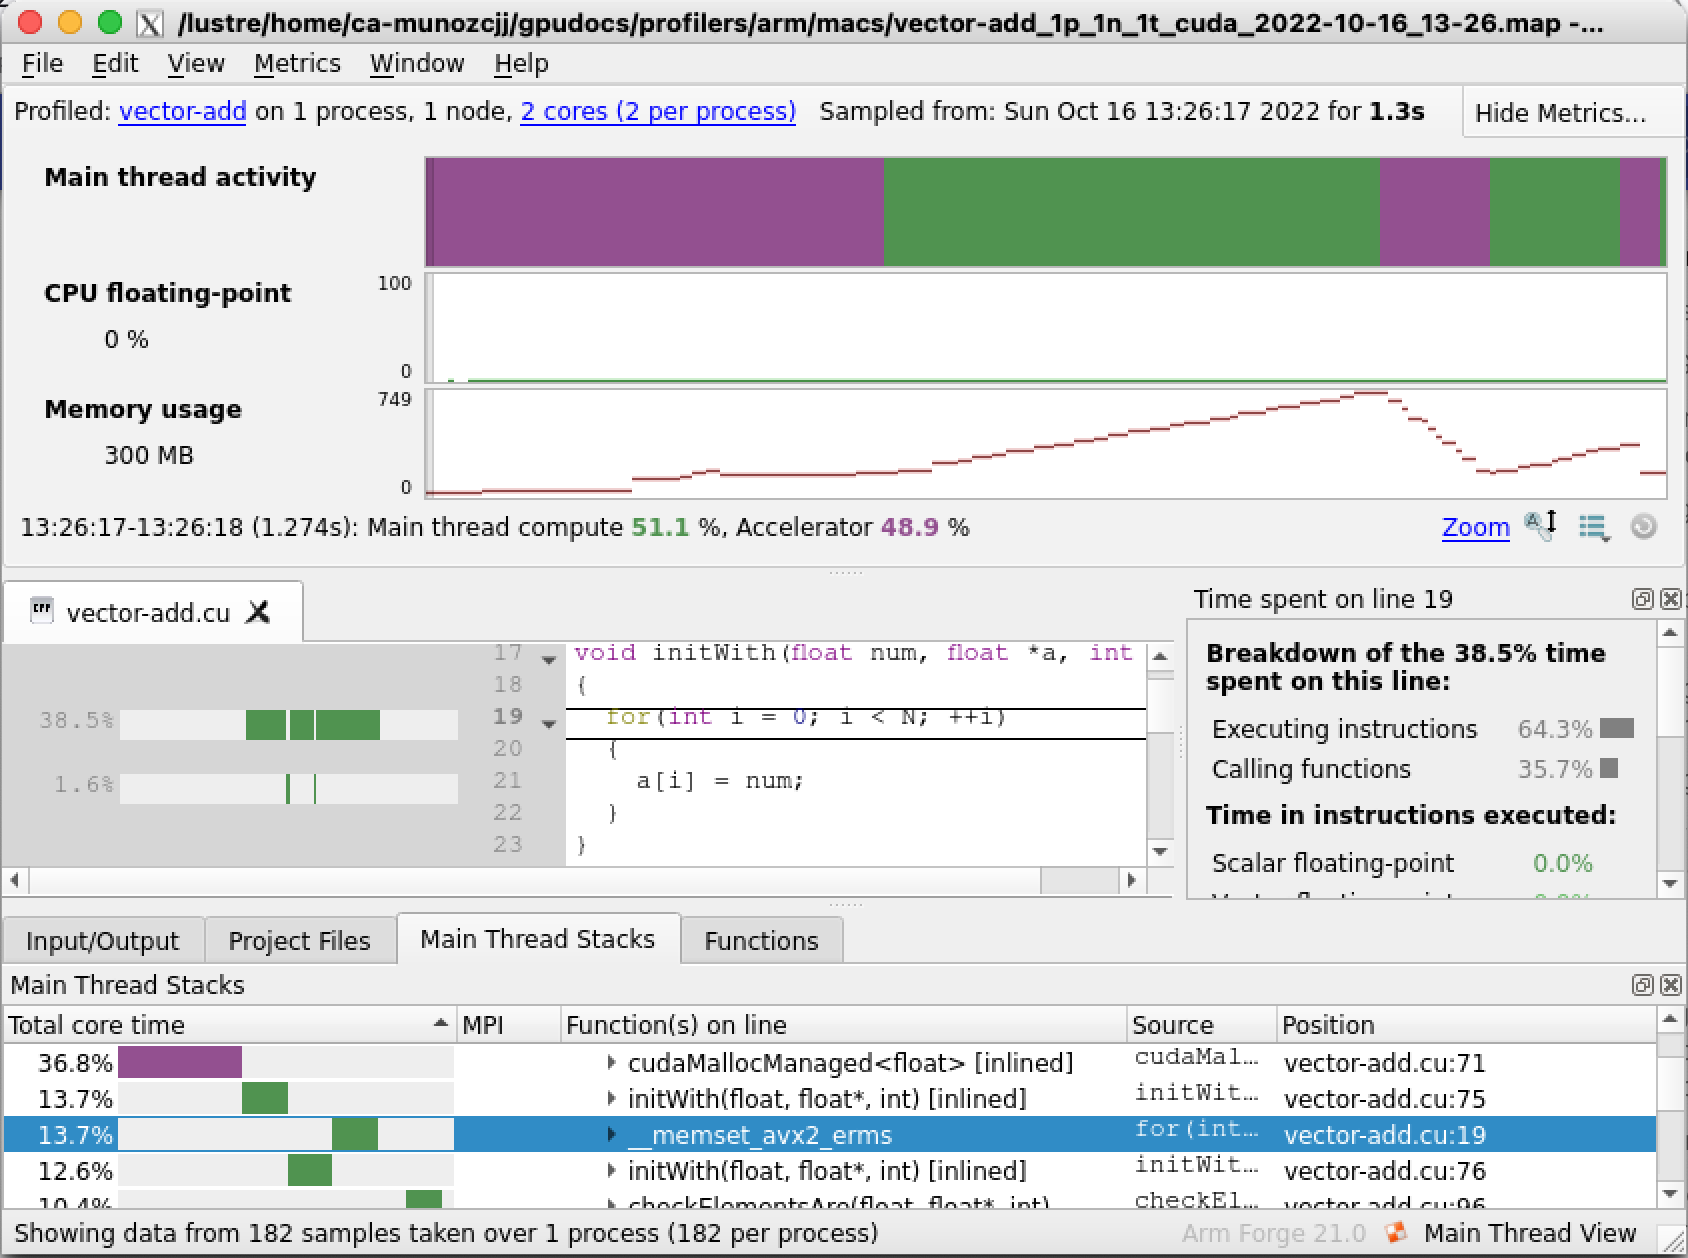
|
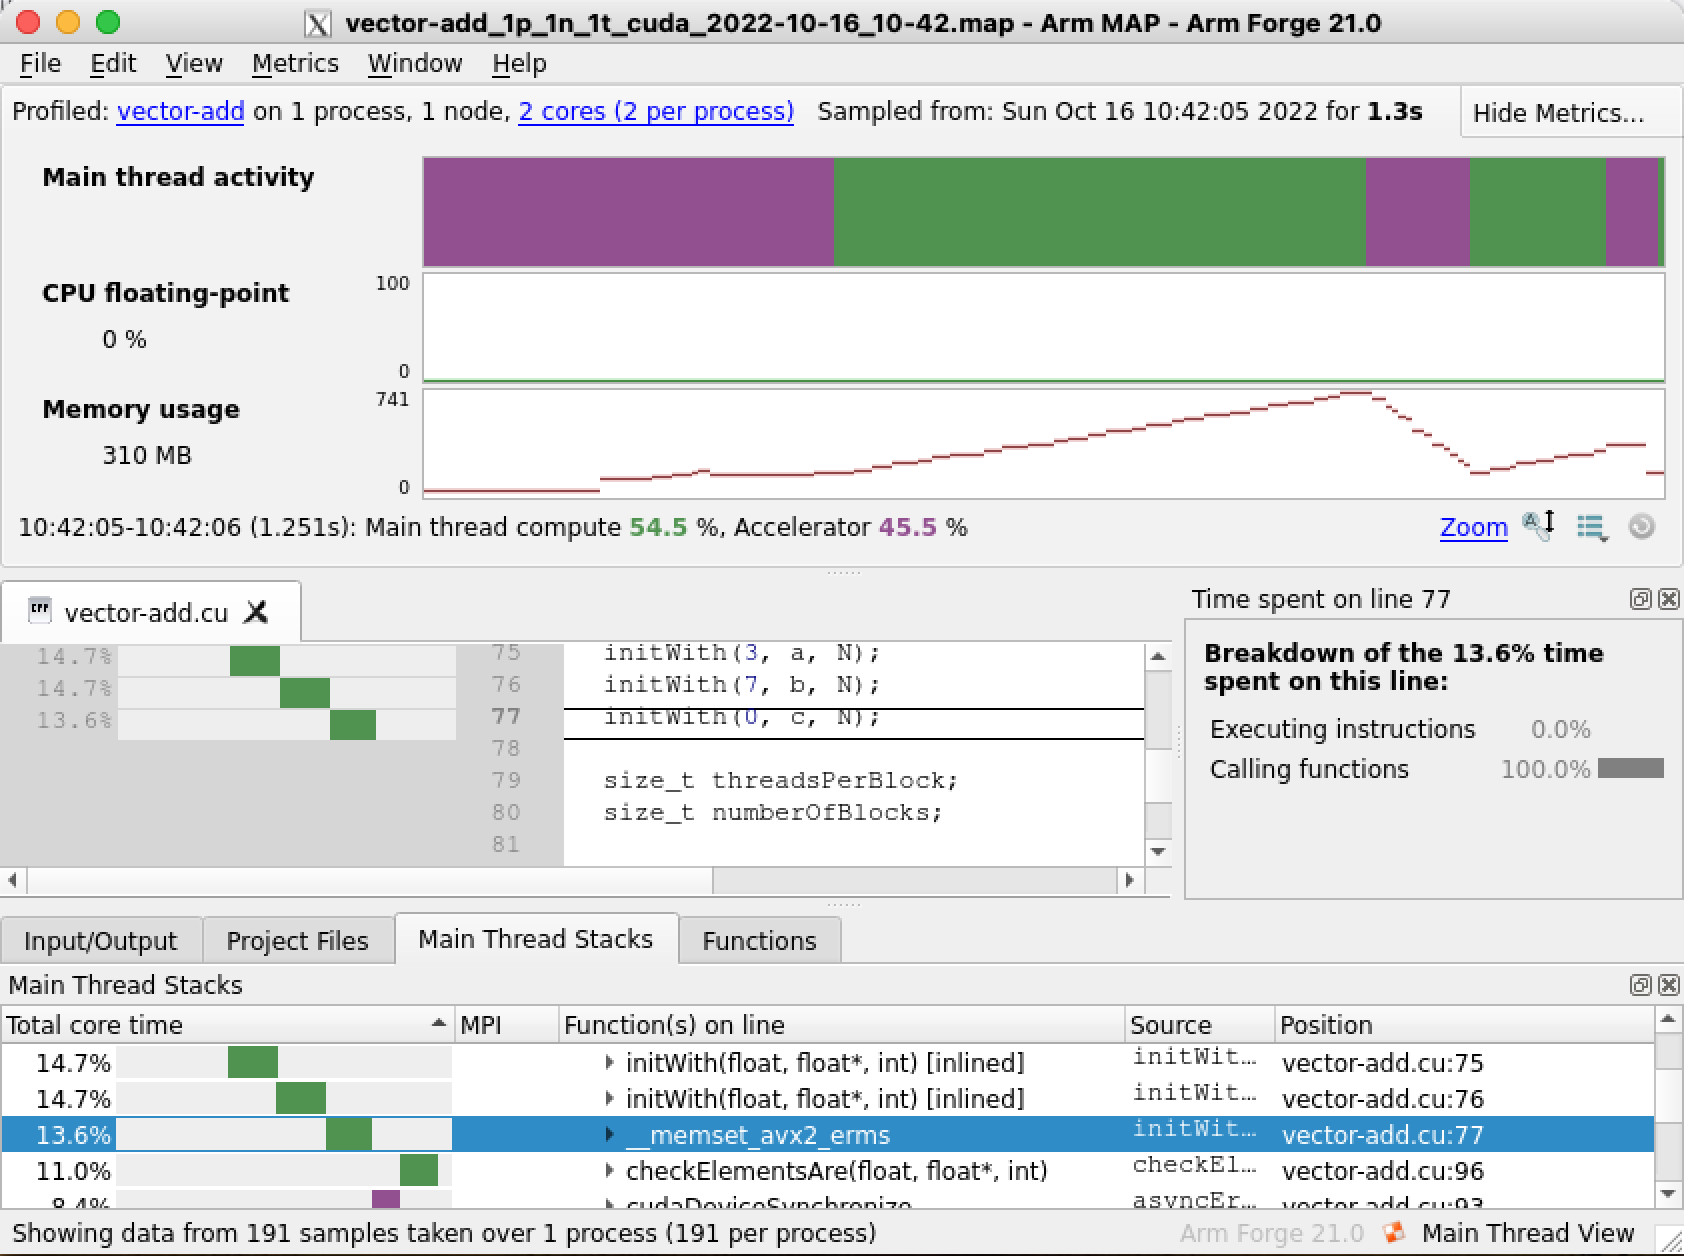
Select Run and the profiler will start analysing the code. On completion a new window will open with the analysis results, a map file will also be generated in our current directory, for example vector-add_1p_1n_2022-08-11_18-56.map, you can use this file to explore the profiler results again later on if needed. On the results window there are several sections with useful information. Arm MAP makes it very easy to observe how much time was consumed on the CPU and GPU. The Main thread activity timeline (top section circled in red) shows in purple the time spent by the CPU waiting for the GPU while green indicates the time spent on the CPU. The Main Thread Stacks section (bottom region circled in blue) shows a more detailed description of the functions being accessed organised by spent time. We can immediately see that our code is spending a lot of time (30.3% of the whole program duration) on the CPU, on the initWith host function. This suggests that our code could potentially benefit from accelerating this function by making it a GPU kernel.
A potentially more convenient way to run MAP is through the job scheduler (especially for jobs with long runtimes). The method is very similar to running the profiler through the command line but a job script with appropiate directives to interact with the job scheduler is also needed. On Isambard we use PBS PRO and the following job script could give you a good starting point:
#!/bin/bash
#PBS -N pascalq
#PBS -q pascalq
#PBS -l select=1:ncpus=16:ngpus=1
#PBS -l walltime=00:15:00

set -eu

module purge
module load cuda11.2/toolkit/11.2.0
module use /software/x86/modulefiles
module load tools/arm-forge/20.1
module list

# change WORKDIR to point to your program location
WORKDIR=/home/$USER/gpudocs/profilers/arm/macs
cd $WORKDIR

# compile
nvcc -c -o vector-add.o -g -lineinfo -O3 vector-add.cu
nvcc vector-add.o -o vector-add

# profile
ALLINEA_SAMPLER_INTERVAL=1 map --profile vector-add
The environment variable ALLINEA_SAMPLER_INTERVAL controls how often samples are taken in your code (in ms). By default MAP will sample the code every 20 ms but if the code runs for a small amount of time (like in our example) it might be good to increase the sampling rate (the maximum sampling rate is 1000 Hz or 1 ms).
As with the command line interactive method, the above script will produce a map
file that can then be used to start MAP on the login nodes to analyse the profiler
results. Don’t forget to ammend the -l walltime and -l select options to
fit your program requirements.
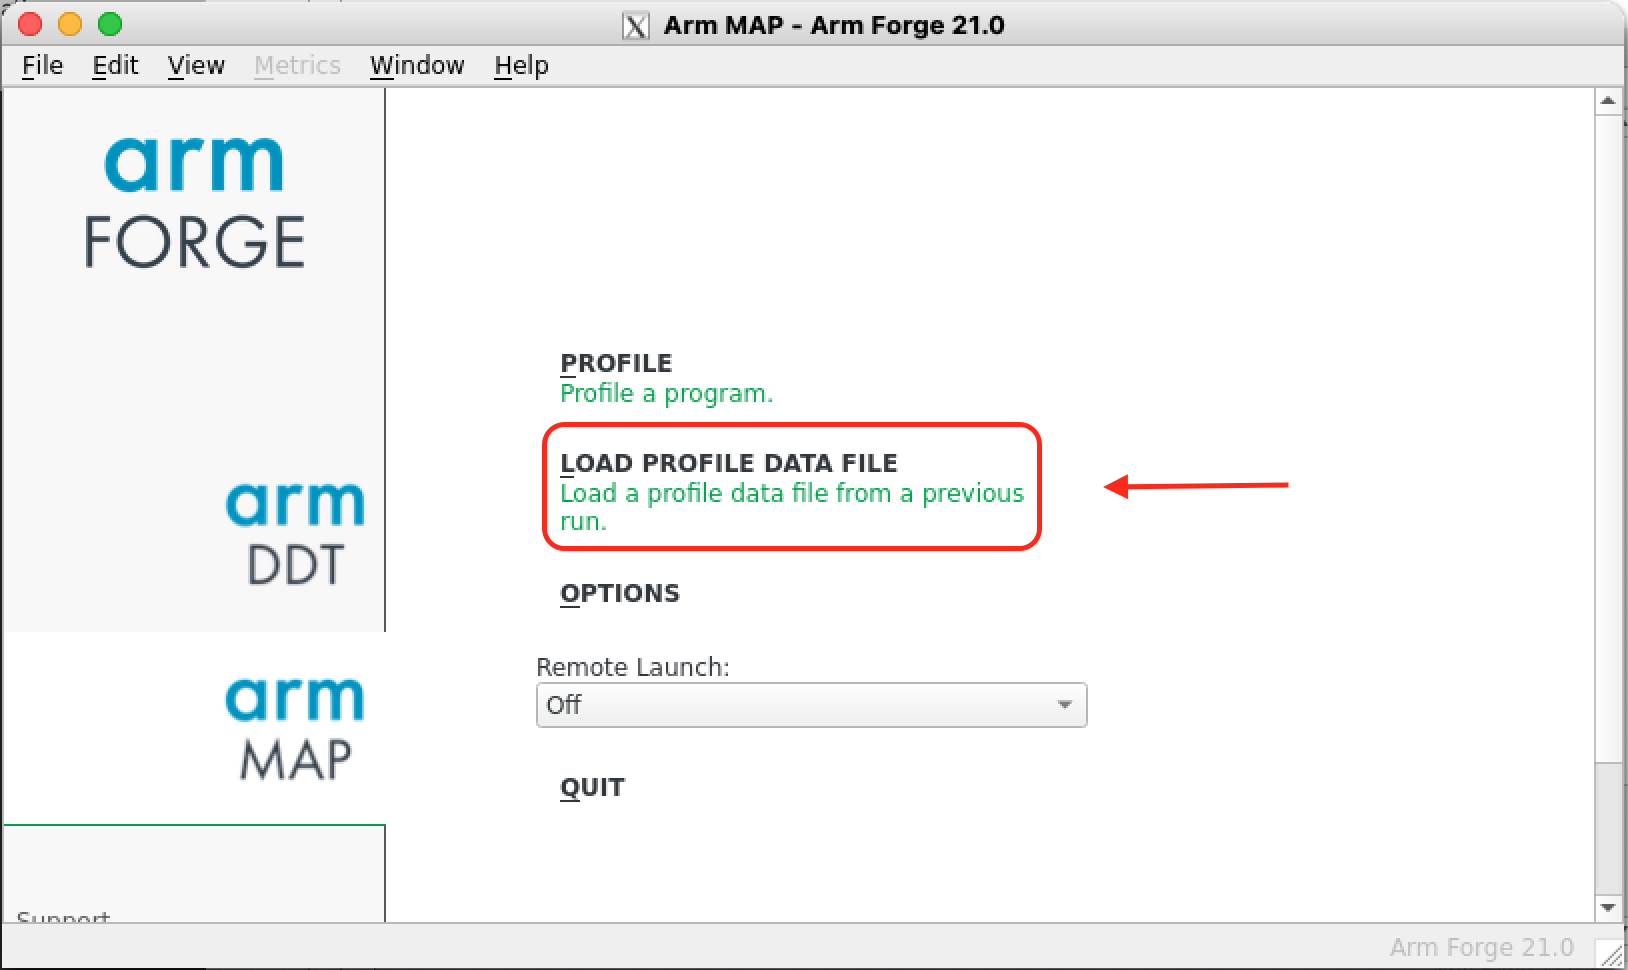
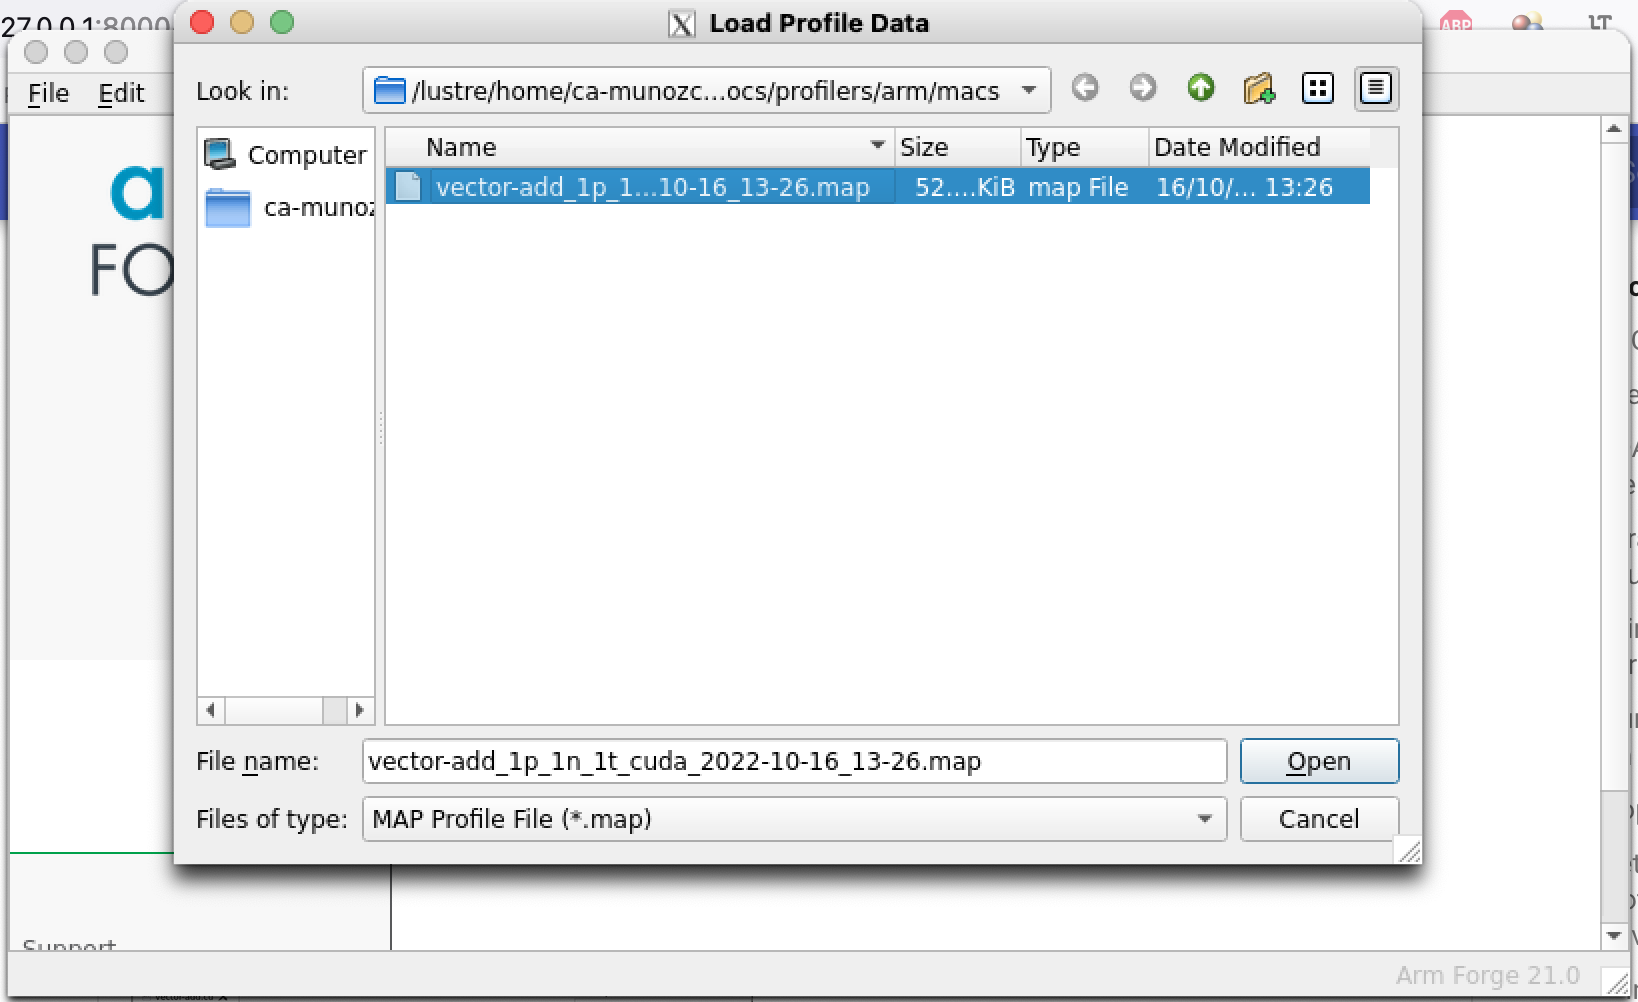
Load a profile data file
If later on you want to explore again the results produced by MAP, you don’t need to request an interactive session anymore, it is enough to connect to the system with X11 enabled, load the arm-forge module and run map on the login nodes. Then on the startup menu select LOAD PROFILE DATA FILE to load a profile data file from a previous run (left image below). Then select the appropiate map file (right image below). A new window with the profiler results will appear.
|
|
|
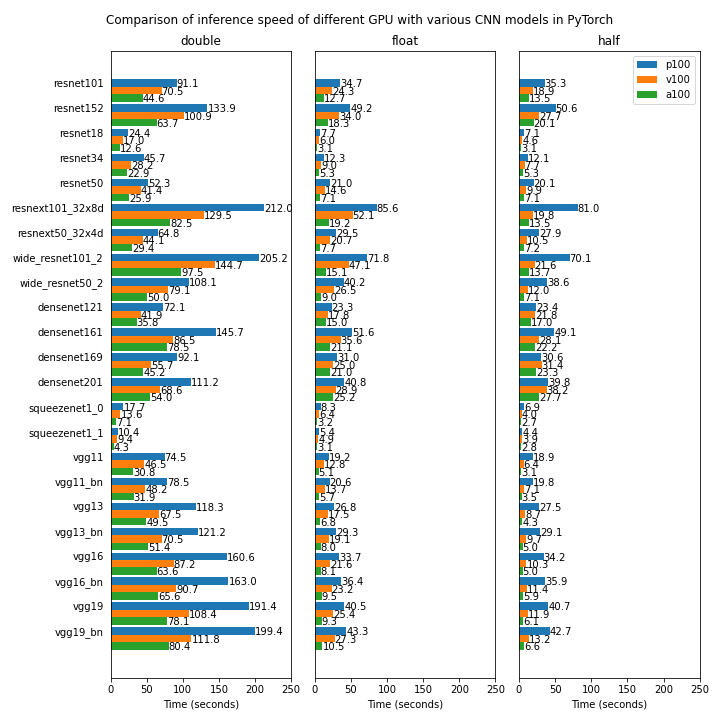
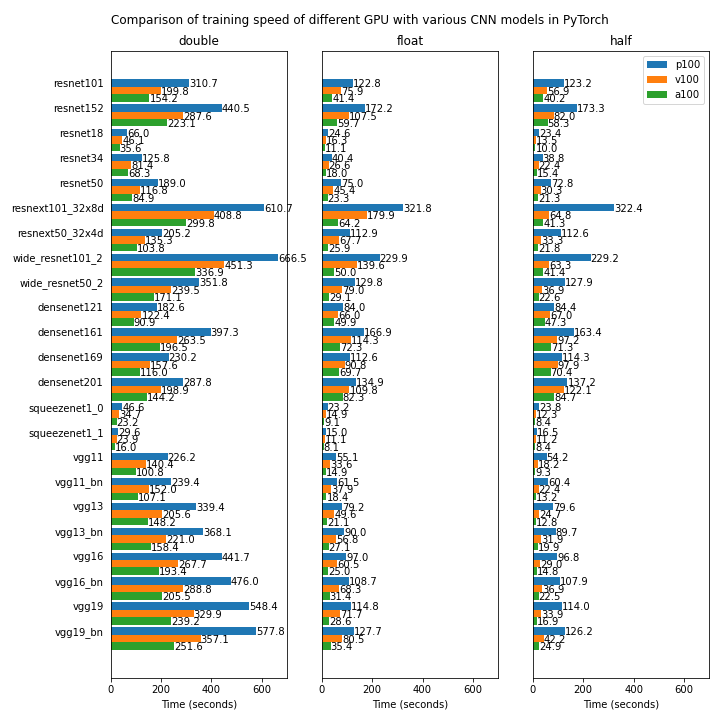
Benchmarking
We compare the performnace of some of the GPU devices available on Isambard (NVIDIA P100, NVIDIA V100 and NVIDIA A100) using several popular CNN models for visual classification implemented in Pytorch.
The first test uses a randomly generated dataset and is run on a single GPU. The source code for the test can be found in https://github.com/ARCCA/pytorch-gpu-benchmark-synthetic
The reported time is the average time spent in 50 batches (12 images per batch).